Can it work faster? Aka how to use Chrome DevTools to improve your webpage performance

Can it work faster? Almost every front-end developer has heard this question at least once. And let’s be honest — in a majority of cases, it’s a good question. Our web apps are more interesting, more complex, more powerful but also… slow! And when I recently spent one week in a place with super poor internet I painfully experienced that… Fortunately, there are many tools that can help you identify and fix performance problems on your webpage. In this article, I wanna show you those which are available for free and without installing anything inside one of my favorite tools — Chrome DevTools.
Chrome DevTools Overview
Let’s start with a super short Chrome DevTools overview. It’s a set of developer tools built into the Chrome browser, available completely for free. To start using it you just need to open the page to test in Chrome browser and open Chrome DevTools. You can do it in many ways:
- Right-click on any element on the page and choose
Inspectoption from menu - Use 3 dots menu in the top right side of the browser -> Choose
More toolsand later ->Developer toolsoption - Use the shortcut (ctrl + shift + I on Linux/Windows or cmd + shift + I on Mac)
After that, you’ll see a panel similar to the one visible in the screenshot below:

Some time ago I wrote about using it for debugging HTML and styling on your webpage and less known features hidden in this tool, so if you want to check some basics look at those links. Today we’ll focus only on features connected with performance.
Lighthouse Audit
Let’s start with something simple. What is your first action when you had to improve something? For me it’s always understanding the starting point — a good audit in the beginning help me understand:
- the whole picture (are we in a critical condition? or maybe we just need some small fixes?)
- the biggest pain points (what annoys my user/me the most?)
- low-hanging fruits (are there easy-to-perform fixes that can significantly improve the situation?)
There are many tools available on the market which provide performance audits but here we’ll use the Lighthouse option from DevTools. To perform an audit you need to:
- open your webpage in the Chrome browser
- open Chrome DevTools (as described in the first section)
- Go to
Lighthousetab - Choose Mode, Device, and Categories options (of course, including
Performanceoption) - Click
Analyze page loadbutton.
Note: It’s recommended to perform this audit in incognito mode to avoid the influence of e.g. cache to your test.

After a few seconds, you’ll receive a report similar to what is visible below. At the top, there is a summary with a score and the overall result.

The widget is presenting the overall performance score. The scale is 0–100 where a result below 50 is bad, 50–89 is average and you want to achieve 90 or more points. I won’t go into details about how this score is calculated (you can read more about it in the “How the Performance score is weighted” article on the official Chrome blog) but what I recommend is taking a look at Lighthouse Scoring Calculator — the link to it is just below widget with your score.
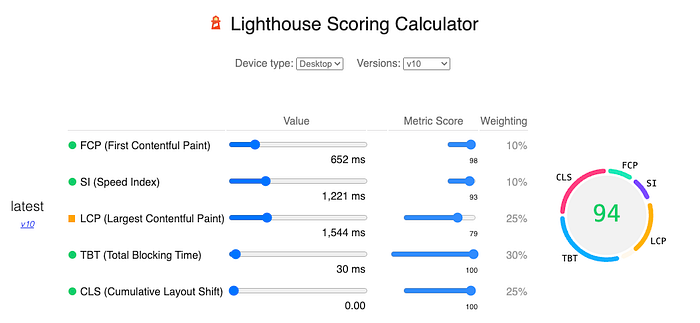
As you can see on the screenshot above you can play with different values and scores for metrics and simulates how it will impact your score. It may be useful to determine which metric should be improved first (as let’s be honest, in real life we rarely have time to fix everything). But there are also some other parts in the report which may help you with that. Let’s go back to the report.
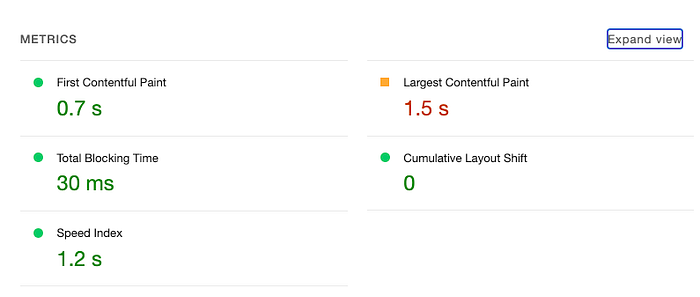
The second section shows a summary of the most important metrics: First Contentful Paint, Largest Contentful Paint, Total Blocking Time, Cumulative Layout Shift, and Speed Index. As you may guess the green color of the value means it’s good, orange suggests it should be improved and red shows serious problems. What do they mean?
- First Contentful Paint (FCP) — this indicator checks how long it takes to render the first DOM element on the page.
- Largest Contentful Paint (LCP) — this one measures how long it takes to render the largest text block or image on the page.
- Total Blocking Time (TBT) — measures how long a page is blocked after user action (click, keyboard press, etc). The sum is calculated from all tasks over 50ms between First Contentful Paint and Time to Interactive (only excess over 50 is taken into account)
- Cumulative Layout Shift (CLS) — measures unexpected shifts of visible page elements
- Speed Index (SI) — measures how long it takes to display text and images on your webpage during load
Of course, also here DevTools can help you understand metrics. Click the “Expand view” button and you’ll see short summary of metrics and links to articles explaining in detail how they are calculated, why they are important, and how to fix them.
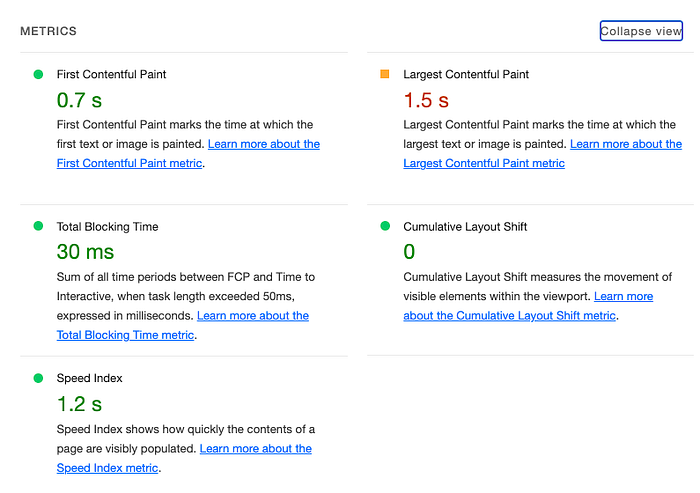
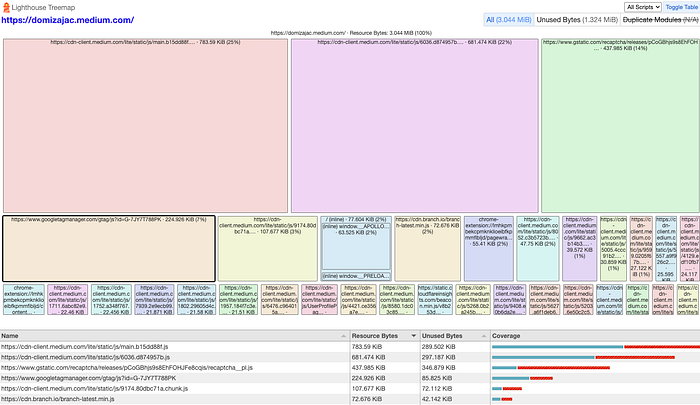
A lot of data, don’t you think? Let’s add even more: below metrics you have buttons to see Treemap and Original Trace. The first one visualizes your JavaScript bundles (helping to e.g. discover unused bytes), and the second opens the timeframe of load in the Performance section of Chrome DevTools (we’ll talk more about this section later in this article).
OK, we have a lot of data but the question is — what can we do with them? Information is powerful only when we can use them. Let’s take a look at the next section in the report: Opportunities and Diagnostics.

Each item in those sections can be extended to show more details and link to the article explaining why it’s important. Sometimes it’s also displaying a list of elements that are influencing a given metric.
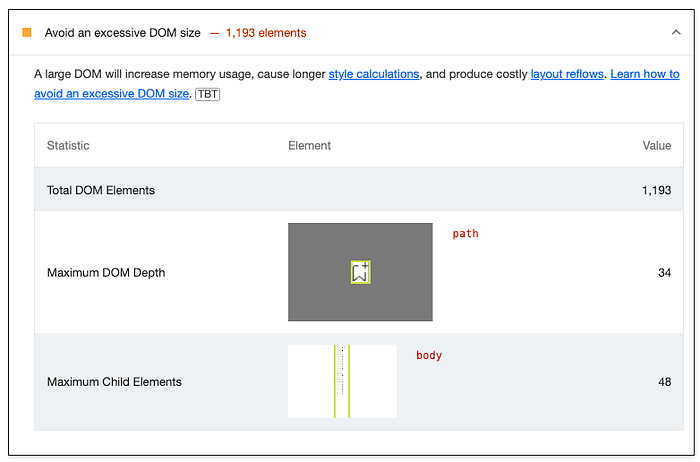
Note: remember that suggestions from Opportunities and Diagnostics can help load the page faster but don’t directly affect the Performance score.
Notice there is also a filter helping you see items only connected with a given metric. If you are a beginner you can additionally take a look at the Passed Audits section to understand which factors are also important for the performance of the page. And that’s all from the Lighthouse audit. But that’s not the only tool in Chrome DevTools that can be used to improve performance. Let’s take a look at the next of them: Performance Insights.
Performance Insights
Performance Insights is a still preview feature but I strongly believe it should stay in Chrome DevTools. Why? Because it significantly simplifies work with performance for developers. You don’t have to fully understand all metrics described in the previous section (even if that’s helpful) to start work. Just:
- open Chrome DevTools
- click the 3 dots button in the top right corner
- Select
More toolsandPerformance insights

After that, you’ll see the interface below.
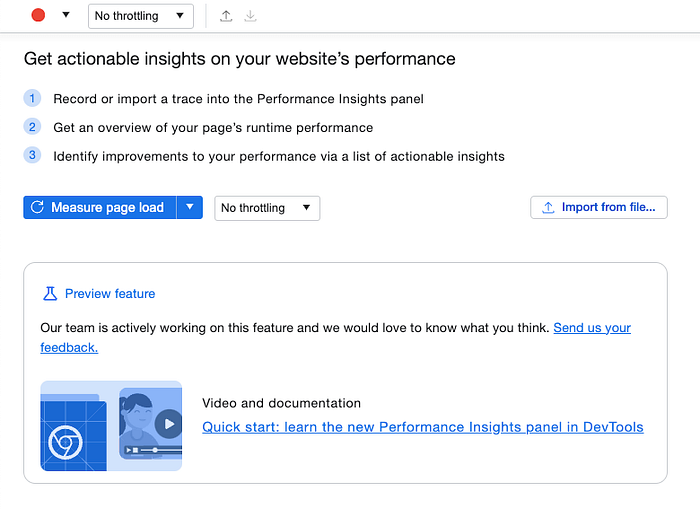
Here you can parameterize the audit. You can choose Network and/or CPU throttle, and disable cache.

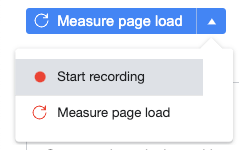
You can also choose if you want to focus on page load or custom scenarios by clicking the dropdown close to the “Measure page load” blue button.
After running the audit, you’ll see a report with a timeline of the most important events.
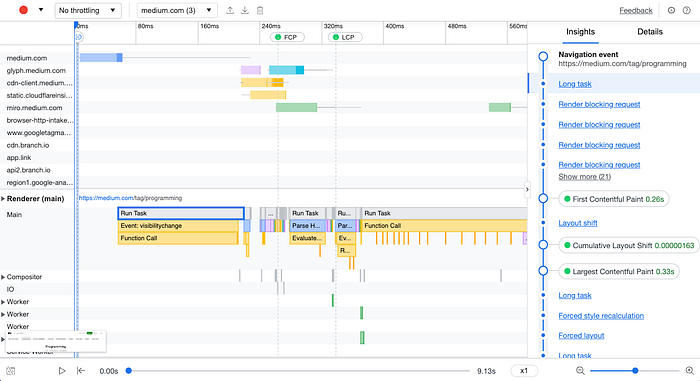
You can replay that (at a different speed), show/hide screenshots or click on a given task to show its details. There is also a small gear icon in the top right corner helping you adjust settings. But what I like the most is the Insights/Details section on the right. You can see a list of the most important events there and with visual marks for e.g. First Contentful Paint, Largest Contentful Paint, etc. When you want to investigate e.g. given long task found before First Contentful Paint you can click on that to preview Details (the given item will be also highlighted in the timeframe on the right so you can easily localize that). Tips on how to fix the problem are super useful!
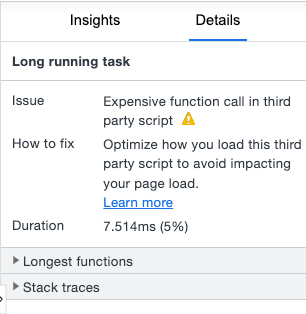
You can also use Import/Export icons at the top to save the report for later.
Performance tab
In the article describing improving performance with Chrome DevTools, I cannot forget about Performance tab as it was created especially for that! But to be honest I see this view as very complex and don’t recommend starting with that — unless you are an experienced developer and you know what you are doing. Personally, I use it only when need details not visible in previously described sections. This tab is providing a sophisticated overview of all events on your webpage. To start recording:
- open Chrome DevTools
- go to
Performancetab - Click the recording icon in the top left corner to start recording your custom script or the reload button to record loading the page
Note: It’s best to perform the audit in incognito mode.
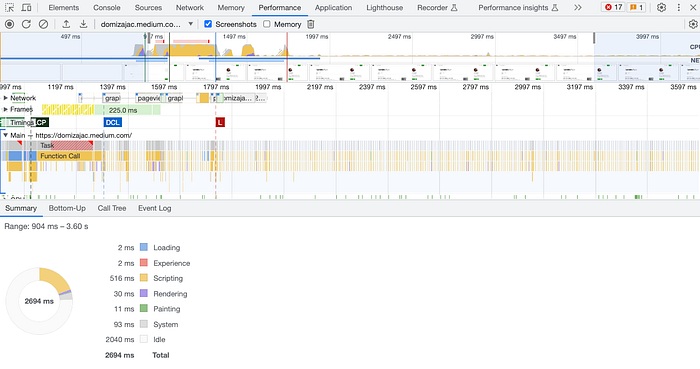
As you can see, there are many details visible on this page. You can decide if you want to record a custom scenario or page load, you can also import/export profile from the disc. Clicking the gear icon in the top right corner you can also set additional settings — like throttling, enabling advanced paint instrumentation, etc. What’s nice, in network throttling you can not only choose one of the predefined options but also create a custom profile. There is even a small trash icon forcing garbage collection during recording a page!
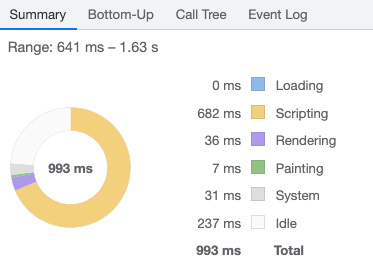
When the report is ready, you can use selectors from the left or/and right side to narrow down the time range you want to focus on (you can take a look at the time at the top or screenshots of the visible content). The donut chart at the bottom in the Summary section will show you a breakdown of the activity, so you can see how big percentage of events was connected with Loading, Scripting, Rendering, etc. You can also switch tab to e.g. Bottom-Up to see which task took the most of the time (and see its subtasks).
Talking about tasks — when you expand the Main section in the chart you’ll see a call tree of all tasks. The red rectangle in the top right corner of the most parent task informs you that this task was marked as a long one and probably needs some improvements. You can read more about optimizing long tasks in the great article written by Jeremy Wagner.

When you are looking for some specific task you can use a search box visible after clicking Ctrl+F or Cmd+F keyboard shortcut. You can even use regexes there.
There are much more data visible in the chart — you may be interested in looking at the Frames row (for detecting e.g. frame drops), the Timings (showing important metrics like Largest Contentful Paint, First Paint, DOMContentLoaded Event, etc), and the self-explaining GPU section. I won’t describe all information visible in the Performance tab here (as this article should be 5 times longer then) but strongly recommend using this tab when debugging performance issues on your webpage!
Performance Monitor
Now, time for the Performance monitor tab. It’s a feature that allows you to receive a real-time view of different performance aspects like CPI usage, JS heap size, DOM Nodes, JS event listeners, and more. You can open it via a few steps:
- open Chrome DevTools
- Click the 3 dots menu in the top right corner
- Click
More toolsandPerformance monitor
After that, you should see a view similar to the one below.

You can interact with your page and check how your actions will influence the scores. You can also click on the names of metrics to hide/show them in the chart on the right side. Unfortunately, it won’t give you any recommendations on which values are OK and which are not so it’s up to you to figure out what’s happening and if is it right. It’s why I recommend this view only for more advanced programmers.
Extras
All the things I presented till now are big features having their own tabs. But there are also smaller ones worth mentioning here! Here I’ll describe 2 of them: Paint flashing and Scrolling Performance Issues.
Paint flashing
Paint flashing is a great mechanism to visually check if only the required elements are repainted on the page (and helps to detect during debugging e.g. which component is constantly re-rendering). When it’s turned on, you can use your page or navigate through it and repainted elements are marked in green.
To enable this option:
- Open Chrome DevTools
- Click the 3 dots menu in the top right corner
- Choose
More toolsandRendering - Check the tooltip close to
Paint flashingoption
Scrolling Performance Issues
In the same Rendering tab you can find also another interesting option called Scrolling Performance Issues. When enabled, it marks elements that can slow down scrolling. It’s a small but interesting feature — I don’t use it super often but helped me a lot while investigating more difficult problems.

Summary
I know this article is long — but it’s because the topic of performance is so interesting and difficult! There are definitely much more features in Chrome DevTools and tips you can take to improve your webpage. But I hope that those described in this article we’ll help you. If so — leave some comments or claps under this article or share it with friends. Thanks in advance!